Statistics
This page shows various statistics from the matches that have been played.
This page is displayed by going to the main menu of the scoreboard page and selecting Statistics.
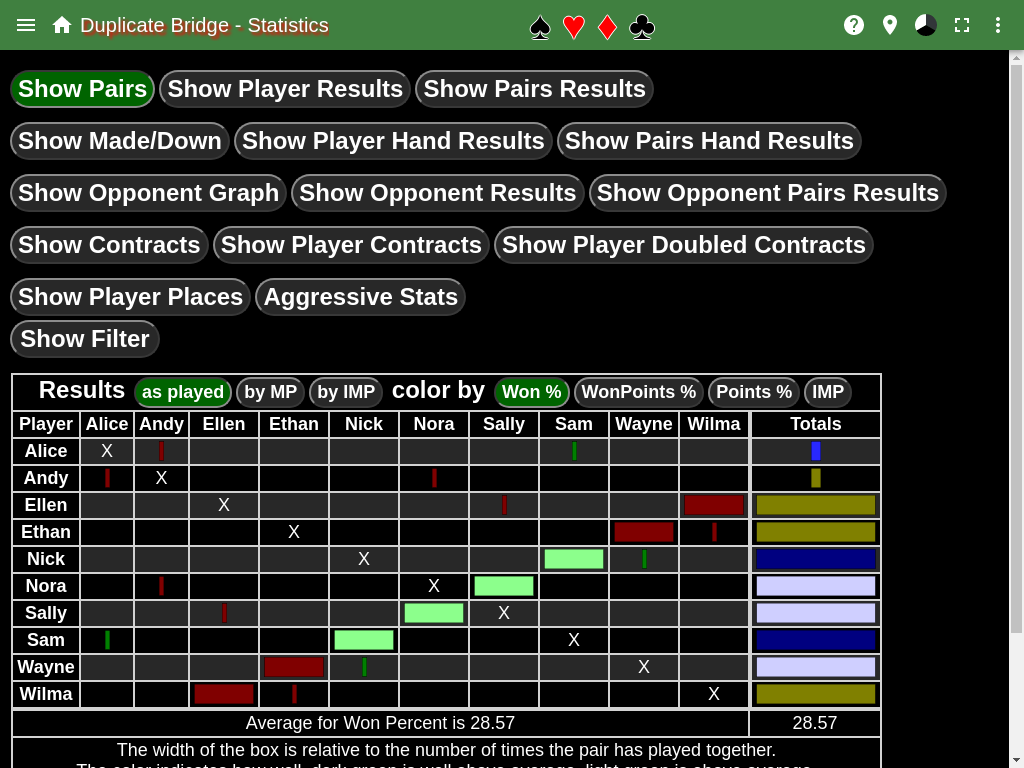
Show Pairs
This shows a table where the rows and columns are the known players. The size of the bar in a cell indicates how many matches the pair played, while the color indicates the result, red indicates below average, green above average, the lighter the color the closer to average.
The cells can show either the percent won by the pair, the percent of win points won, and the percent of points earned.
The final column is the total for the player in the row. The size of the bar indicates the number matches the player played, while the color indicates the result. Yellow indicates below average, blue above average, the lighter the color the closer to average.
Show Player Results
This shows the player data in table form that is displayed by the Show Pairs table in the totals column.
Show Pairs Results
This shows the pairs data in table form that is displayed by the Show Pairs table.
Show Made/Down
This table shows the result of the hands played by the pair. The size of the circle indicates the number of hands played by the pair. The colors indicate the result. Green indicates a positive score, red indicates a negative score, blue indicates a passed out hand. A dark color indicates the pair defended, a light color indicates the pair had the contract, one of the was the declarer.
The final column, Totals, shows the aggregated result for the player in the row.
Show Player Hand Results
This shows the player data in table form that is displayed by the Show Made/Down table.
Show Pairs Hand Results
This shows the pair data in table form that is displayed by the Show Made/Down table.
Show Opponent Graph
This shows the results when two players oppose each other. An opposing player is an opponent on the same table, or a player on another table that is in the same NS or EW position.
There are two circles in each cell. The first one shows the match results, green indicates the row player beat the column player, red indicates the column player won, while gray indicates a tie. The size of the circle indicates the number of matches the players played as opponents.
The second circle shows the results of the hands. Green indicates the row player won the hand, red the column player won the hand, gray indicates a tie. The size of the circle indicates the number of hands the two played as opponents.
Show Opponent Results
This shows the player data in table form that is displayed by the Show Opponent Graph table.
Show Opponent Pairs Results
This shows the pair data in table form that is displayed by the Show Opponent Graph table.
Show Contracts
This shows the results of all possible contracts that have been played. There are two sections to the table, the left shows all contracts, while the right only shows doubled or redoubled contracts. This is to show the results of doubled contracts, in the left table the doubled contracts are typically very small circles since they don’t happen very often.
In the left section, there are up to three circles in each cell, the first one is for undoubled contracts, the second is for doubled contracts, and the third is for redoubled contracts. In the right section there are up to two circles in each cell, the first is for doubled contracts, the second for redoubled contracts.
The passed out cell is shown in both sections and represents the same number of hands. It is to give a reference to the sizes in the two sections.
The colors indicate the result. A green color indicates a made contract, while red indicates the contract went down.
Player Contracts
Show Player Contracts
This table shows all the hands that a player has played, and what the result was. The size of the circle is relative to the number of hands played. The first two columns show the type of contract played or defended. The type of contract is passed out, partial game, game, slam, grand slam. The next two column shows the hands that were played or defended. The remaining columns show the results of each type of contract.
Show Player Doubled Contracts
This table shows the hands that a player has played that were doubled or redoubled. The columns are the same as the Show Player Contracts table, with the addition of a new type of contract, doubled into game.
Show Player Places
This table shows the place the player came in. The size of the circle indicates the number of matches the player played in, while the colors indicate the place the player came in.
Aggressive Stats
This table shows how aggressive a player is. There are three types of aggressiveness that is shown. The size of the circle indicates the number of hands was played.
The first two columns show the hands played when the same side played the contract, but the contract was different. The aggressive column is the higher contract, the passive column is the lower contract.
The next two columns show the hands played when different sides played the hand. The competitive aggressive column is the higher contract, while the competitive passive is the lower contract.
The last two columns show the hands played when the hand was passed out at one table. The Passed Out Aggressive column is when the hand was played, while the Passed Out Passive column is where the hand was passed out.
Show Filter
This enables a filter that allows players to be filtered out of any of the above statistics.